The probes in the test
| Name |
Model |
Year |
Part Number |
| 1200 MHz 3 mm TCI |
CP2.1 TCI 1200SA H/C/N-D-03 Z |
2021 |
Z161014 |
| 1200 MHz 5 mm TXO |
CP2.1 TXO 1200SA N/C-H-D-05 Z XT |
2022 |
Z175498 |
| 900 MHz 5 mm TCI (old) |
CP TCI 900S6 H-C/N-D-05 Z |
2005 |
Z44910 |
| 900 MHz 5 mm TCI (new) |
CP2.1 TCI 900S6 H-C/N-D-05 Z XT |
2021 |
Z168416 |
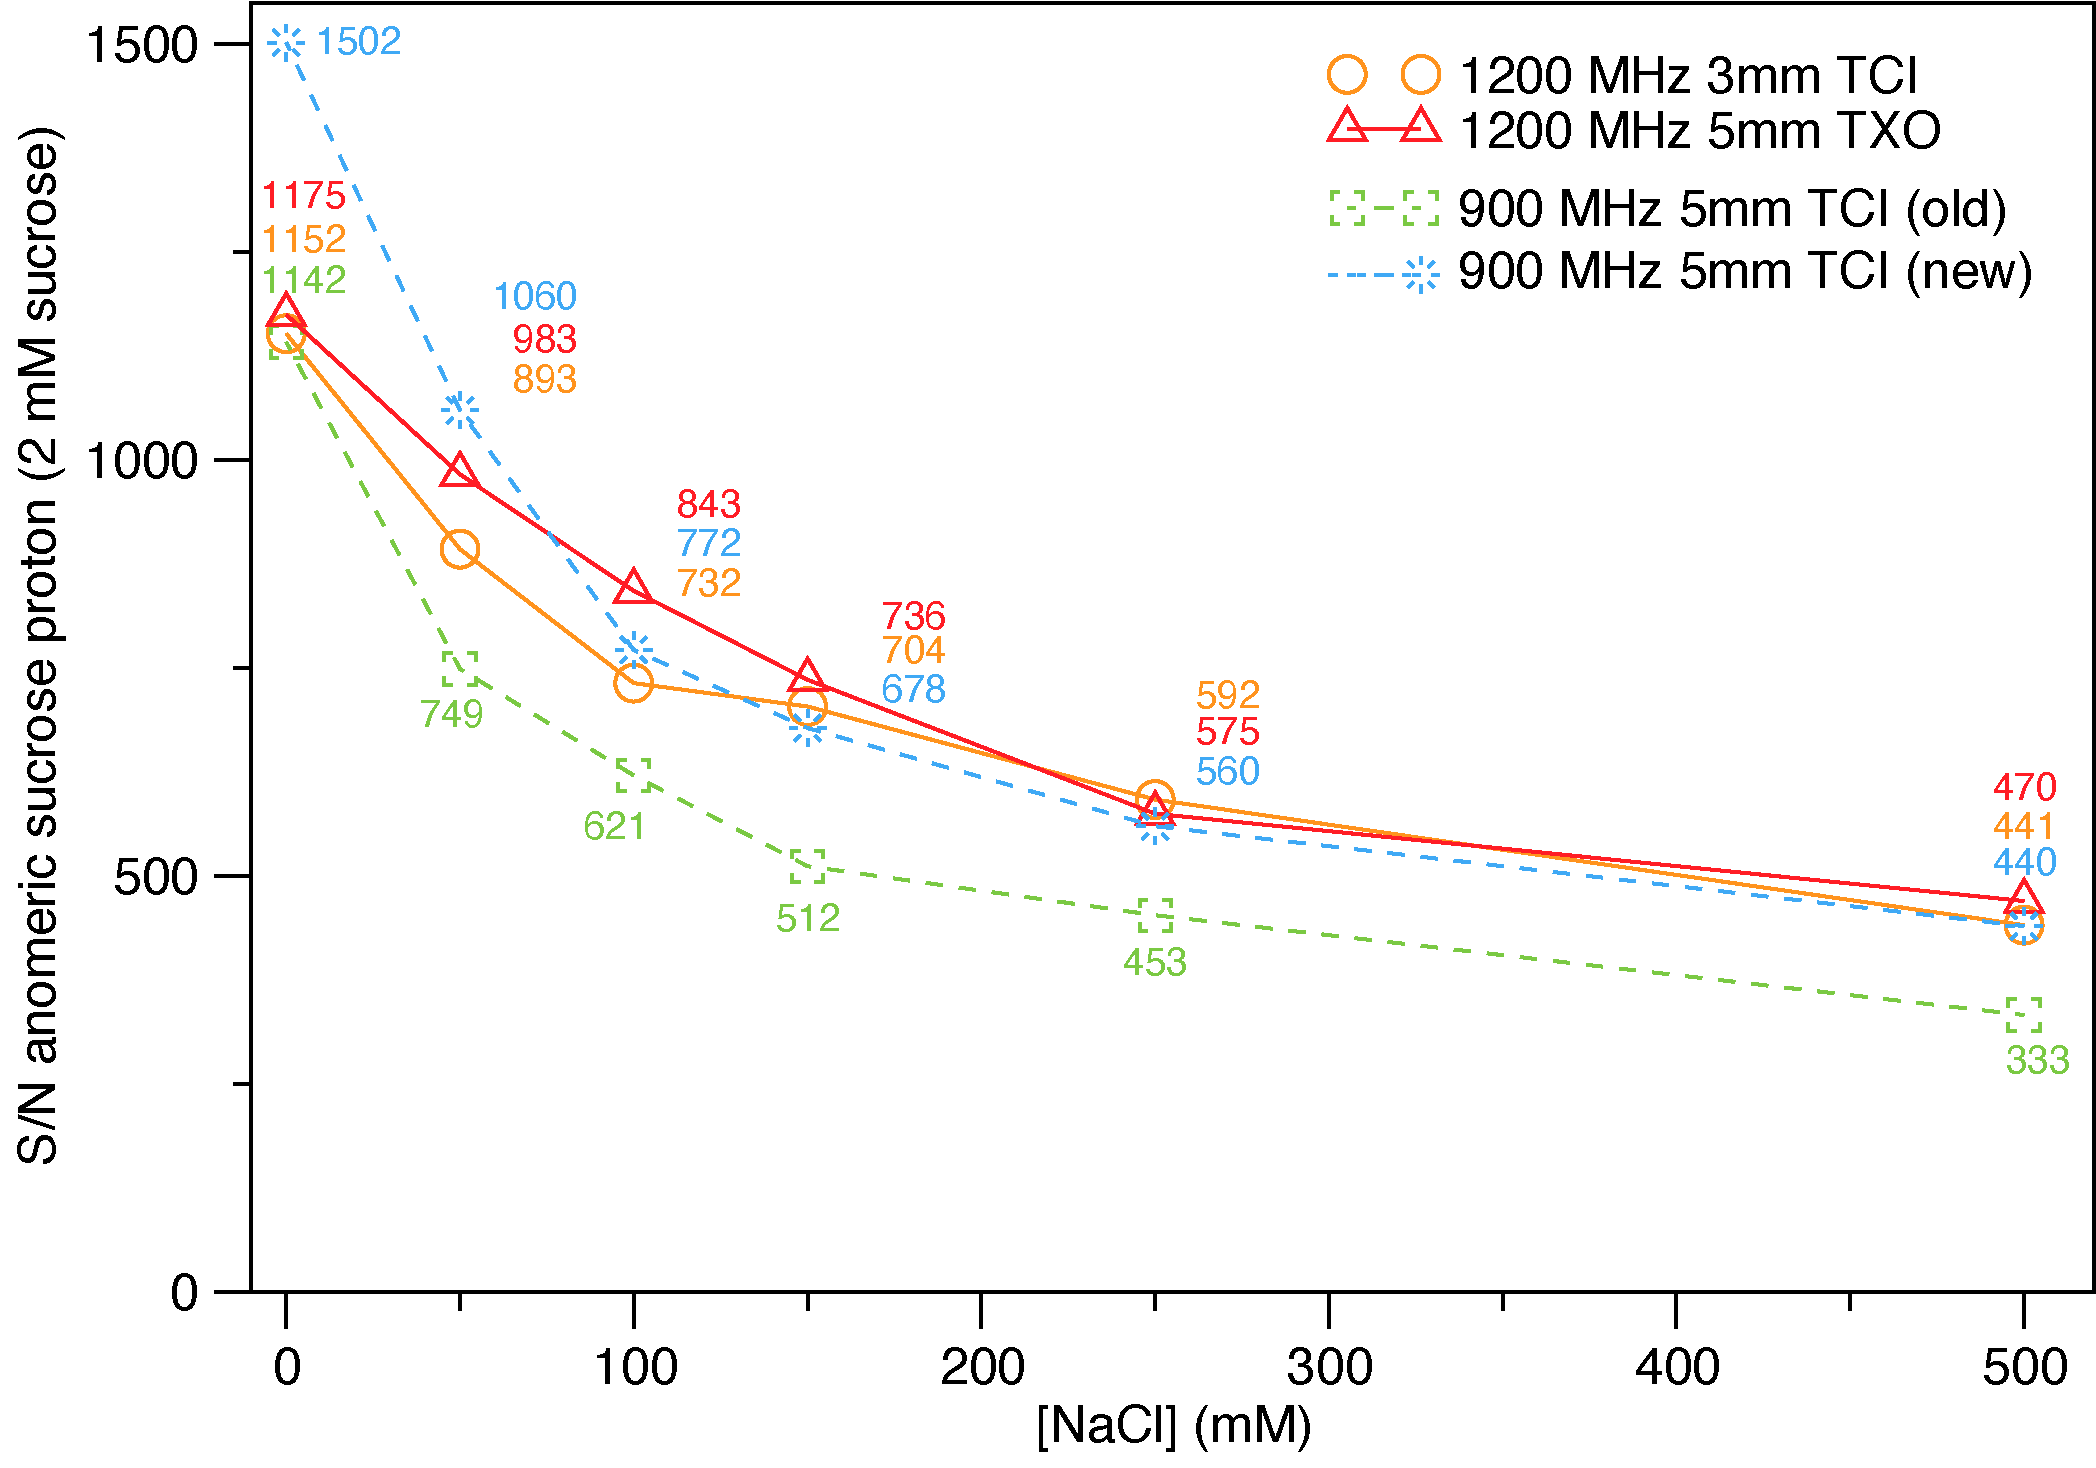
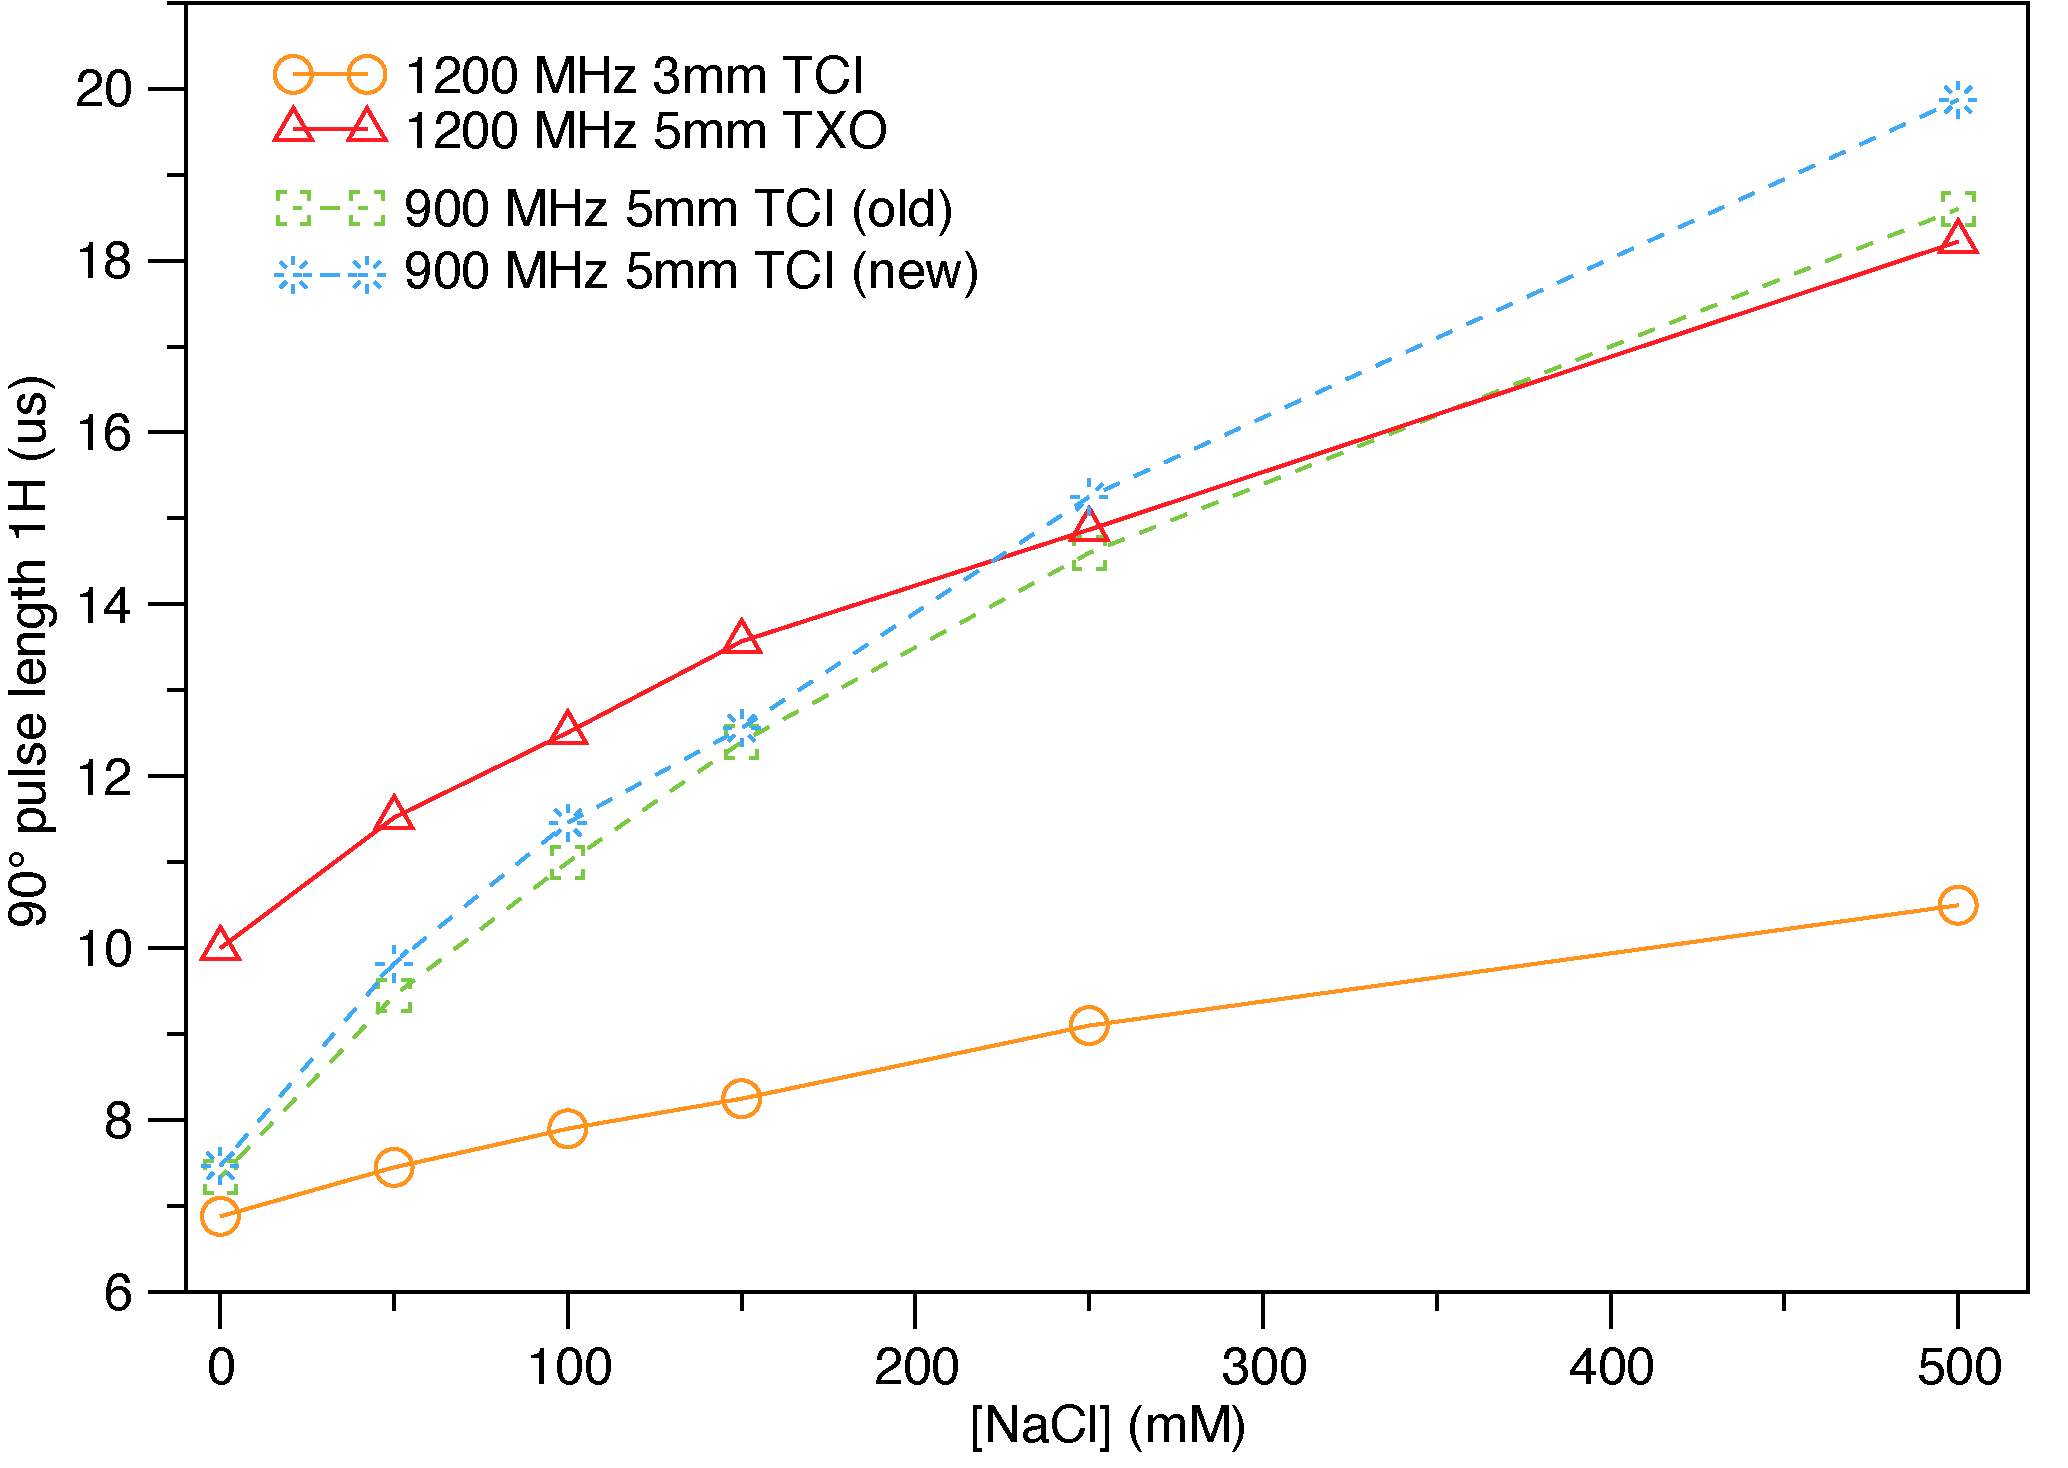
Ionic strength dependence of sucrose sensitivity.
Using home-made samples with 2 mM sucrose and 0 – 500 mM NaCl in either standard 5 mm (sample volume 600 µL) or thin-walled 3 mm (sample volume 280 µL) tubes, we find the following results for the 90-degree 1H pulse length and S/N of the sucrose anomeric proton.
The sensitivity on proteins
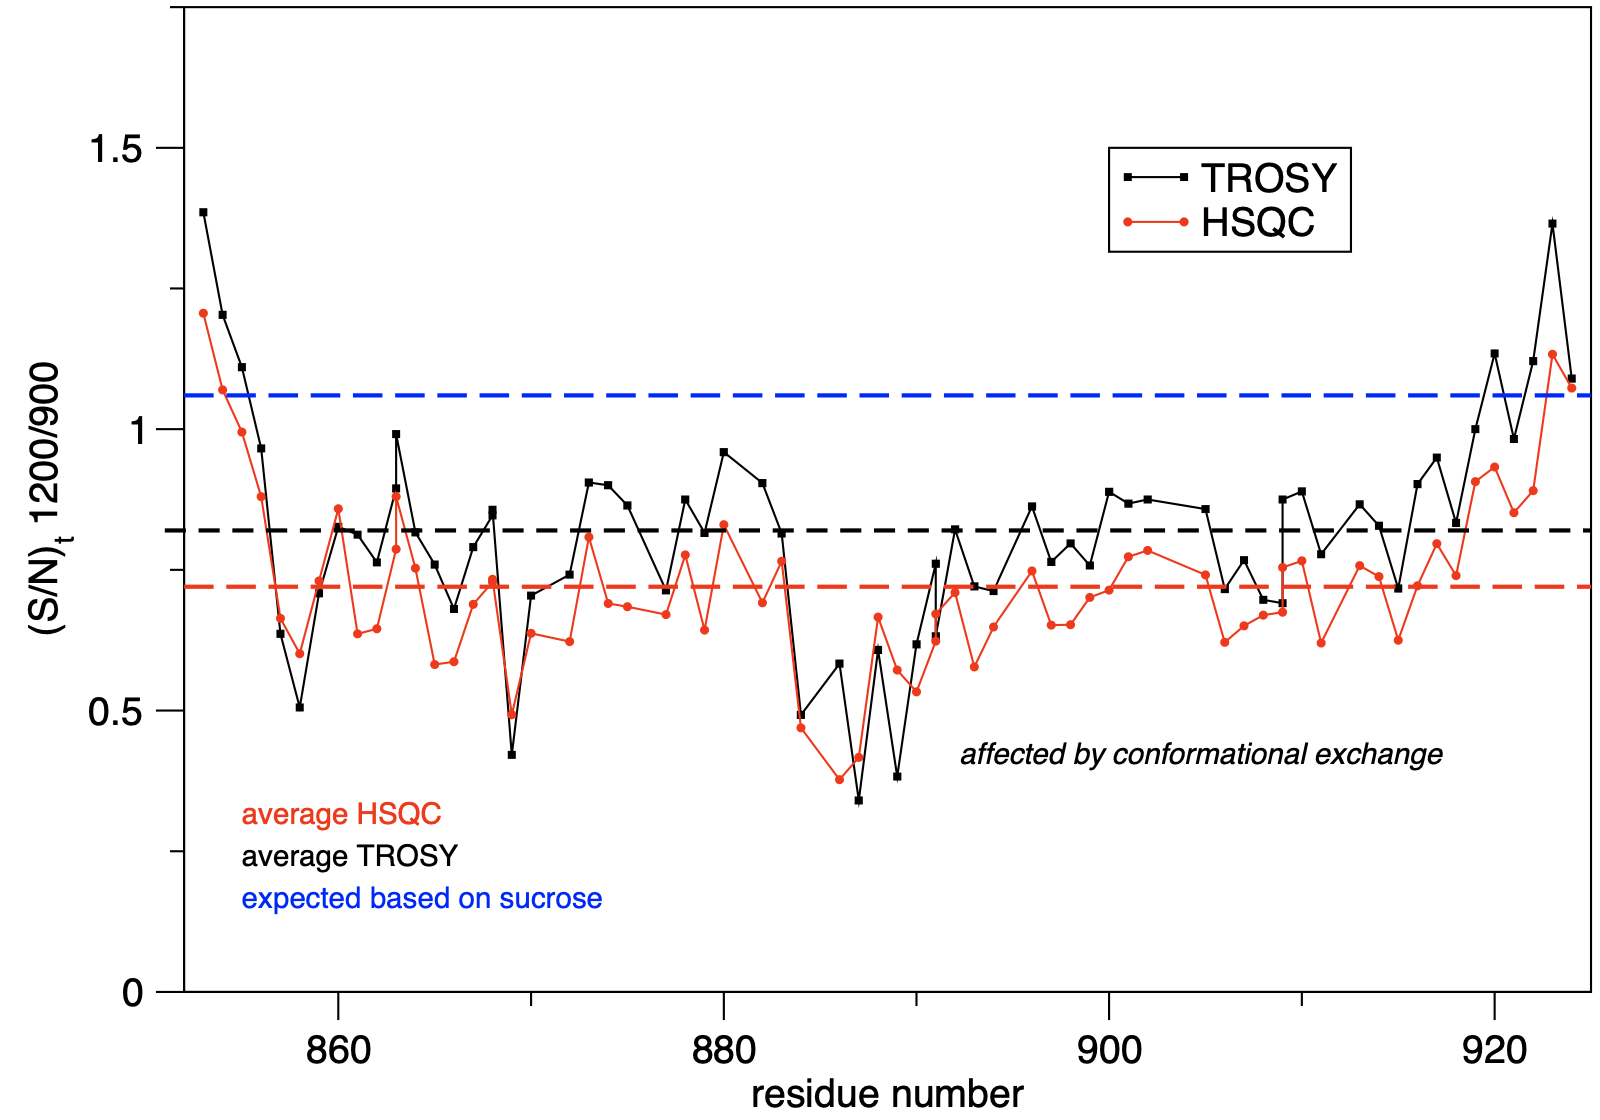
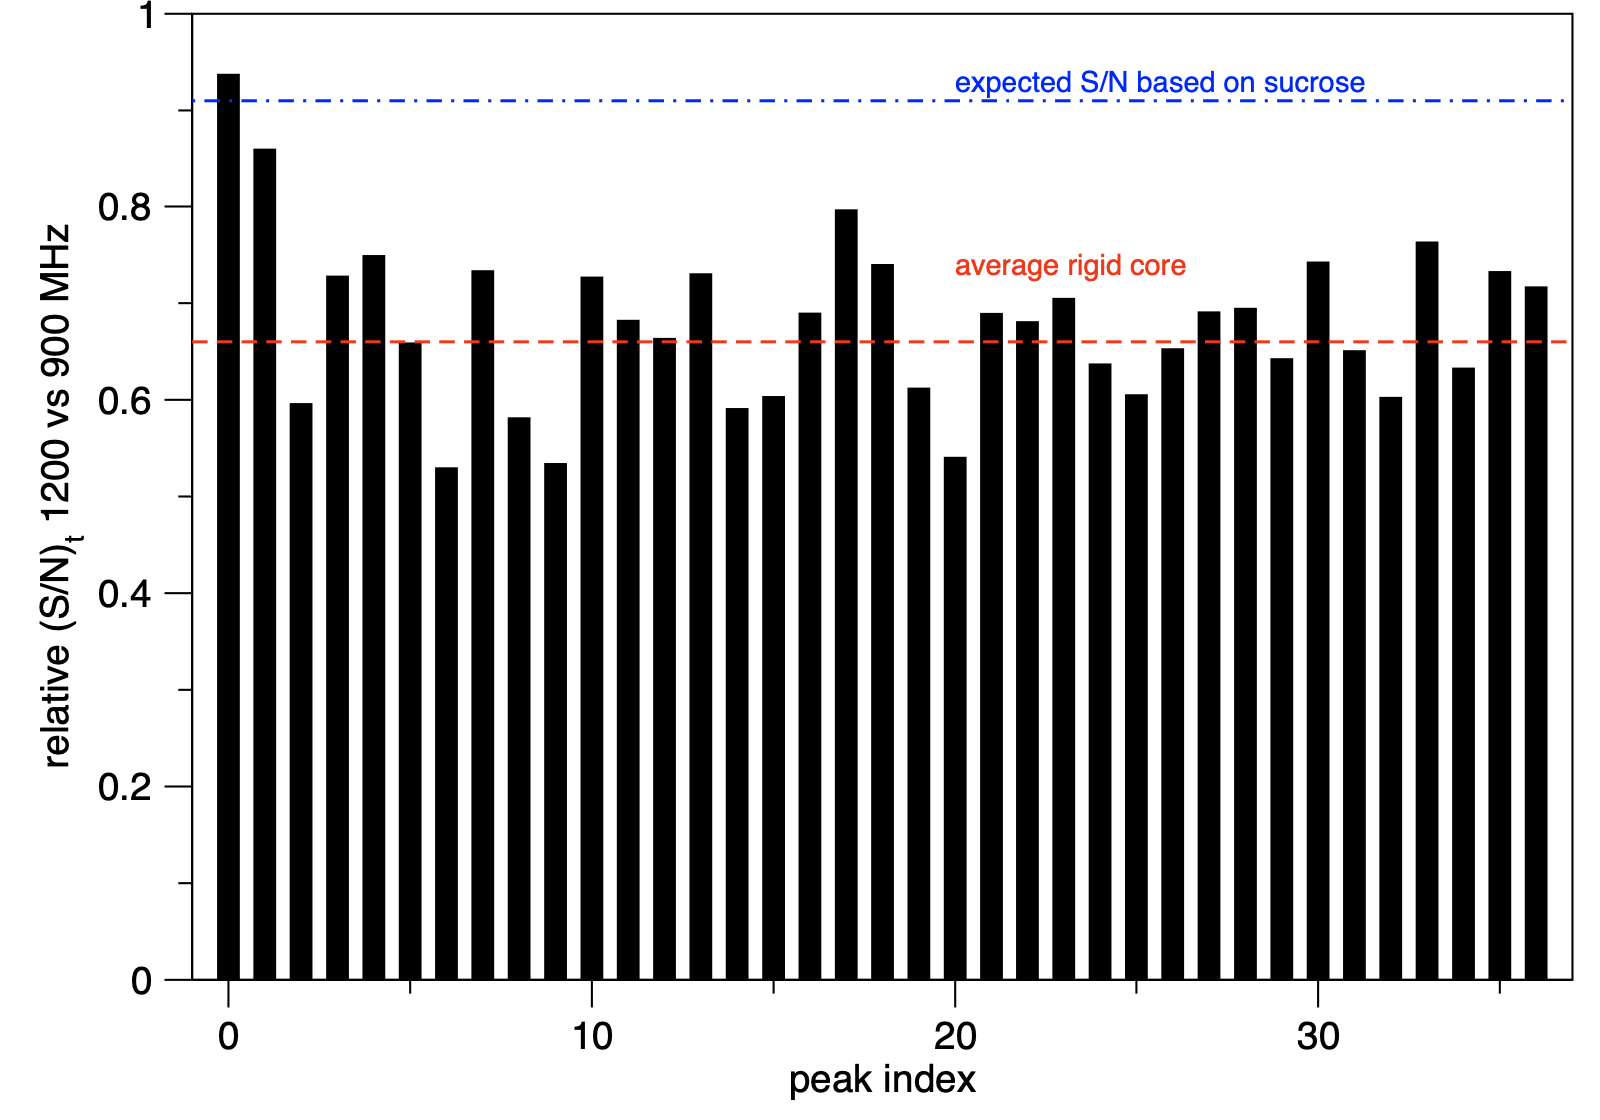
The sensitivity on proteins is what one would expect from the sucrose data: for small/very flexible systems S/N is on par between 1.2 GHz and 900 MHz, but for larger systems the effect of increased transverse relaxation due to CSA (even for 13C methyl groups) kicks in and some sensitivity is lost.
This is shown in the plots below. Note that these were done with an old 900 MHz probe, so comparison against the new probe would be even worse for 1.2 GHz.
15N HSQC and 15N-TROSY S/N for small protein
S/N in Me-TROSY on nucleosome
Both TCI and TXO probes perform fine, also CPMG relaxation dispersion experiments with high load on 15N perform fine.
Magnetic field alignment effect is really powerful at 1.2 GHz.
The data is courtesy of dr. Vincenzo Lobbia and dr. Hugo van Ingen.
This is great. It is completely in agreement with measurements I’m making at 1.2 and 850 MHz at OSU. Do you have a table of the pulse width data you could share? I’d more directly compare with my results and you nicely have the SINO values on the top plot.
But, moral of the story thus far is, for any normal protein with a little bit of salt, all these probes give the same raw sensitivity (5mm TXO 1200, 3mm TCI 1200, 5mm TCI 850/900).
Have you measured the 13C and 15N pulse widths for different salt concentrations on the TXO? Our ‘spec’ for 15N is 32 us which was achieved for methanol/urea but my protein samples are all ~42 us.
Hi Alex!!
Good to hear from you! sorry for the delay in responding …
I did not measure systematically the 13C/15N pulse as function of salt, I was using a series of 2 mM surcrose sample for the data above. (values attached, i just pasted it, hopefully when you copy it back in text editor it will show up properly again…)
But looking back at my data, 13C pulse was 10.4 us (106W) and 15N 32.5us (55W) on low salt sample (20 mM HEPES) and also same at 150 mM ionic strength…
I haven’t been using the system for some time now, hopefully soon again to get more experience
data:
#salt p1 res s_n (1200 TCI) p1 res s_n (900 old) p1 res s_n (1200 TXO) p1 res s_n (900 new)
0 6.88 17 1152 7.34 17 1142 10.00 15 1175 7.47 15 1502
50 7.45 18 893 9.45 16 749 11.52 13 983 9.82 11 1060
100 7.90 19 732 11.0 17 621 12.51 12 843 11.46 12 772
150 8.25 17 704 12.4 19 512 13.57 13 736 12.56 13 678
250 9.10 18 592 14.6 16 453 14.87 16 575 15.25 13 560
500 10.5 22 441 18.6 18 333 18.22 15 470 19.87 12 440